Yes. In 2025 Brazil's trade surplus was US$68.1 billion, according to MDIC consolidated data, and from January to September 2026 it reached US$62.4 billion.

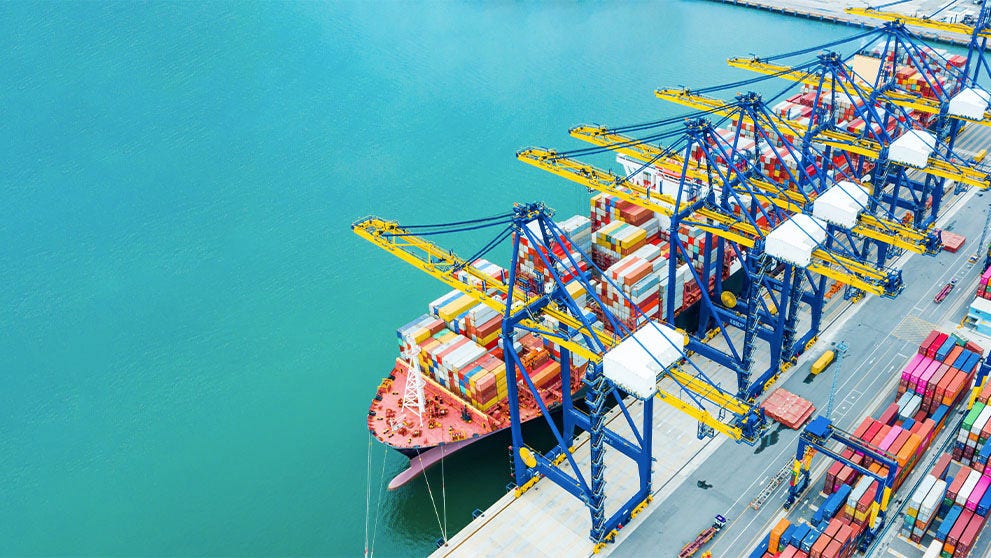
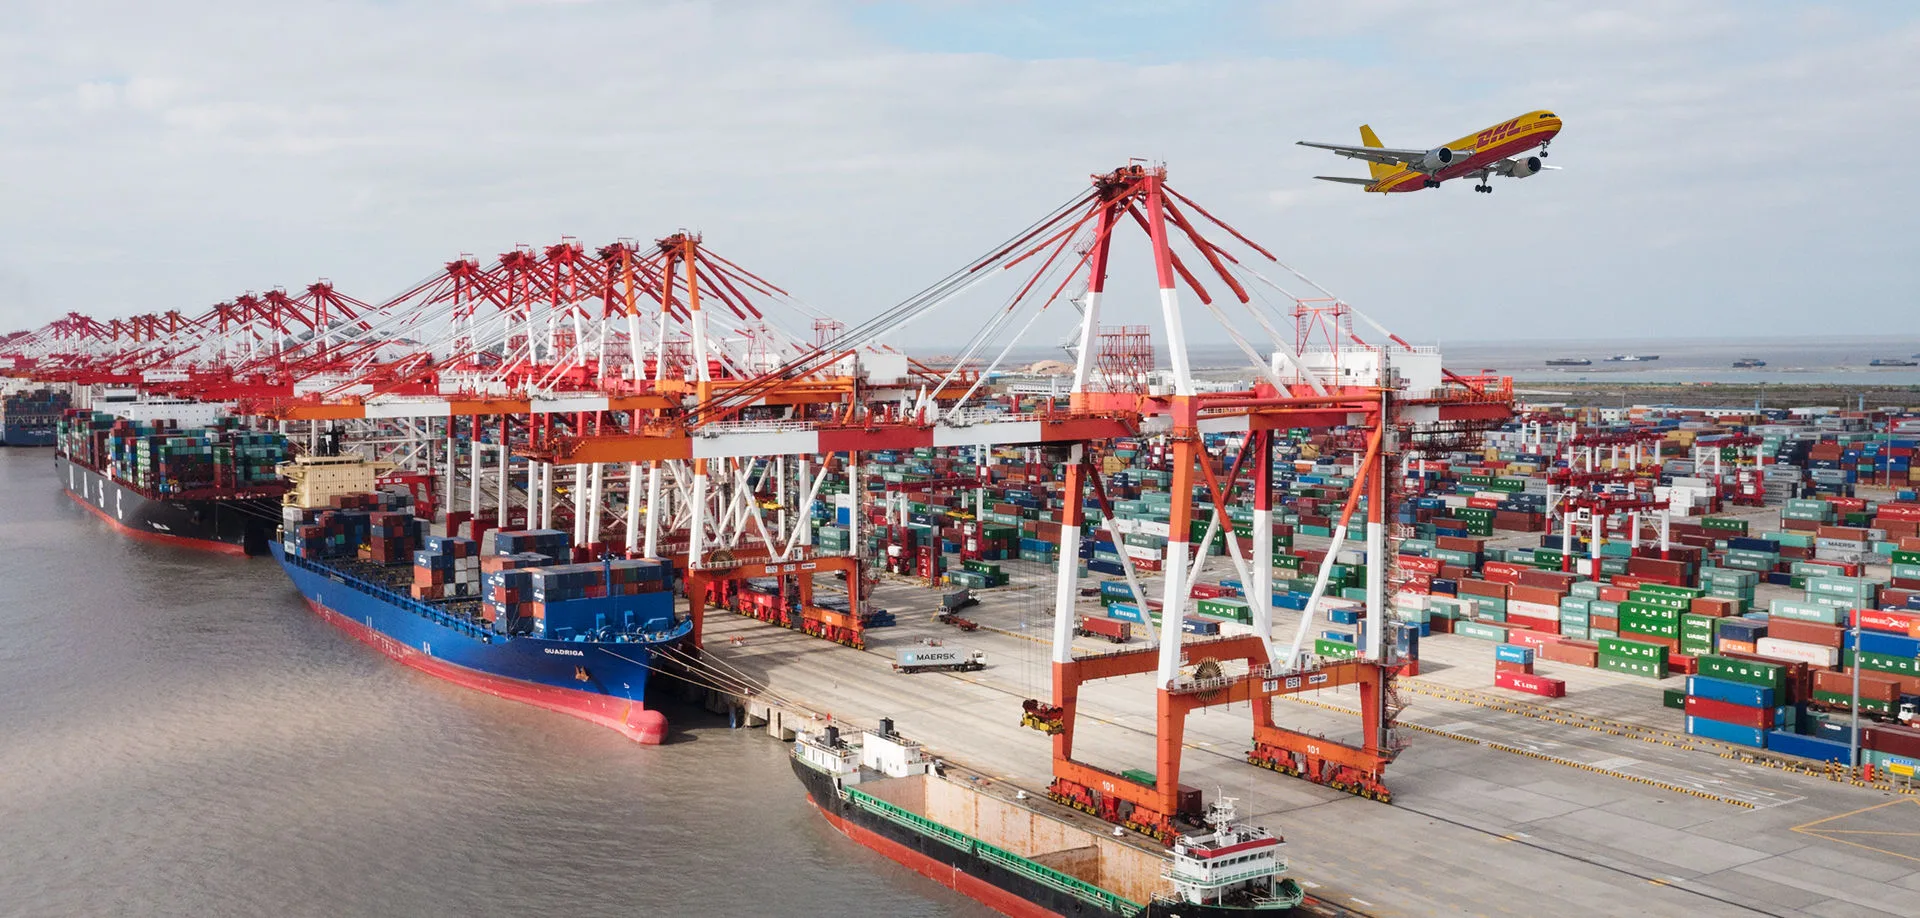
Brazil's main exports are crude oil, soybeans, iron ore, beef and coffee. In 2025 the country sold US$348.3 billion worth of goods abroad, the highest figure on record, and China bought 28.7% of the total. The figures come from the Foreign Trade Secretariat (Secex) of MDIC, Brazil's trade and industry ministry.
For a company buying from Brazil, or a Brazilian manufacturer planning its first export, the export mix is more than trivia. It shows where routes, buyers and infrastructure already exist, and where the room for a smaller manufacturer is bigger than it looks. The detail that changes the picture is the gap between what the statistics call industry and what actually leaves a factory.
Five products made up almost 43% of Brazil's exports in 2025: crude oil, soybeans, iron ore, beef and coffee. The table lists the largest values of the year among the products Secex tracks as a historical series, with each one's share of total exports. Source: MDIC/Secex, consolidated data, October 2026.
Product | Exported in 2025 (US$ billion) | Share of total |
Crude oil | 44.5 | 12.8% |
Soybeans | 43.5 | 12.5% |
Iron ore | 29.0 | 8.3% |
Beef | 16.6 | 4.8% |
Coffee | 14.9 | 4.3% |
Sugars | 14.1 | 4.1% |
Fuel oils | 10.3 | 3.0% |
Wood pulp | 10.2 | 2.9% |
Poultry meat | 8.8 | 2.5% |
Soybean meal | 8.6 | 2.5% |
Maize | 8.6 | 2.5% |
The year moved in opposite directions. Beef grew 42.5% in value and coffee 31.1%, driven by prices. Sugar fell 24.1%. Crude oil and soybeans were almost flat, at 1.0% down and 1.4% up, and only US$1 billion apart. With such a concentrated mix, the price of half a dozen commodities decides the year.
Yes, and more than the official breakdown suggests. By economic activity, MDIC puts manufacturing at 54.1% of 2025 exports, mining and oil extraction at 23.1% and farming at 22.3%. Read that way, Brazil looks like an industrial exporter.
The picture shifts when you look inside manufacturing. Meat, sugar, pulp, soybean meal and fuel oils count as manufactured goods because they are processed. Together they make up about 21% of all exports, close to 40% of what the statistics call industry.
A second lens confirms it. By broad economic category, intermediate goods were 62.9% of 2025 exports, fuels 15.9%, consumer goods 15.4% and capital goods just 5.9%. Brazil mainly sells inputs for other countries' industries.
China takes almost a third of everything Brazil sells, followed at a distance by the United States and Argentina. By region, Asia took 43.0% of exports in 2025, the European Union 14.3% and South America 12.4%. Source: MDIC/Secex, consolidated data.
Destination | Exported in 2025 (US$ billion) | Share |
China | 99.9 | 28.7% |
United States | 37.7 | 10.8% |
Argentina | 18.1 | 5.2% |
Netherlands | 11.7 | 3.4% |
Spain | 8.8 | 2.5% |
Mexico | 7.7 | 2.2% |
Canada | 7.3 | 2.1% |
Chile | 7.2 | 2.1% |
The Netherlands ranks high because of the port of Rotterdam, the entry point for soybeans, meal and other bulk goods heading to the rest of Europe. For a small business, the country figure does not always show where the end customer is.
This is the most useful part for manufacturers. What Brazil sells changes completely by destination. To China, manufactured goods were only 22% of 2025 exports; the rest was soybeans, oil and ore.
In the Americas, the logic flips. According to the same MDIC data, manufactured goods were 94% of Brazil's sales to Argentina, 87% of sales to Mexico and 80% of sales to the United States. In absolute terms, the US bought US$30.2 billion of Brazilian manufactured goods, more than China and more than the whole European Union, at US$23.6 billion.
If you buy machinery, parts, processed food, cosmetics or apparel from Brazil, or make them there, the natural trade lane is closer than the China headlines suggest. US tariffs on Brazilian goods have changed that equation, and the sector impact is covered in our guide to US Section 301 tariffs and Brazil.
Exports grew 10.4% from January to September 2026, to US$284.65 billion, according to MDIC. Three shifts explain the year.
In practice, Asian demand still drives volume and Europe is growing again as a destination. For Europe, rules such as the deforestation regulation weigh on coffee, soy and beef from December, so anyone selling there needs to plan the paperwork together with the order.
Use the national export mix as a map, not an answer. The next step is to look up the specific product by its NCM code (the Mercosur tariff code) and see which countries already buy it from Brazil, in what volume and at what average price. That search is free on Comex Stat, MDIC's official platform, explained in our guide to Comex Stat in Brazil.
Once the destination is chosen, the operational steps (registration, documents and export modes) are in our guide to exporting from Brazil. For small, frequent first shipments, compare express exports with formal exports in courier or formal export from Brazil.
Yes. In 2025 Brazil's trade surplus was US$68.1 billion, according to MDIC consolidated data, and from January to September 2026 it reached US$62.4 billion.
It does. Aircraft and related equipment brought in US$4.9 billion in 2025, 1.4% of the total, and are one of the few high-tech goods with real weight in the export mix.
No. MDIC's trade balance covers goods only. Services such as software and consulting appear in the Central Bank of Brazil's balance of payments statistics.
MDIC releases preliminary trade balance figures every week and publishes consolidated data once a month, early in the following month.
Brazil's export mix shows that room for manufactured goods lies in the Americas and Europe, while China mostly buys raw materials. Take the NCM code, see who already buys from Brazil and send the first sample to a buyer with an order history.
When the first overseas customer says yes, open a DHL Express business account and have your international shipping ready for that first order.


 Share